In the part of supervised models, I talked a lot about classification. In this article, I am just jump into unsupervised models and how they work differently. If you have any confusions about basic concepts about machine learning, you are welcome to read ‘Part One’. Reference
Table of Contents
- Unsupervised models
- Feed-forward network
- Recurrent neural networks
- Convolutional neural networks
- Platform
Unsupervised models
Inputs are continuous or categorical and we have no targets. Goal is to group data cases into a finite number of clusters so that within each cluster all cases have very similar inputs. That is why it is important to find an interesting way to visualize dat. e.g. We can put emerging similar topics in one cluster for news.
 All require a way to measure distance between two data points, e.g. the Euclidean distance.
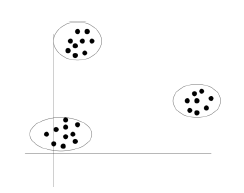
First algorithm I am going to introduce is K-means. It is designed for a pre-defined number of cluster K by randomly initializing a center for each cluster.
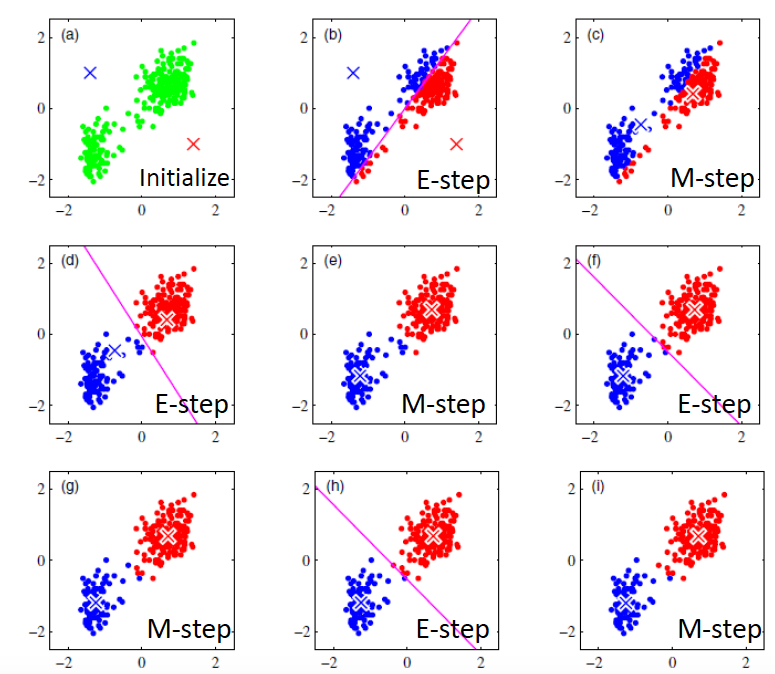
Two simple steps:
E step:For all data points, assign each to the cluster whose center is closet tothis data point.
M step:Update each cluster’s center to be the mean of all points assigned to that cluster
In mathematical terms, for a cluster of observations xᵢ ∈ {x₁, x₂, … , xm}, we wish to find the centroid C that minimises:
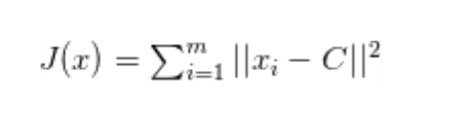 While C is the center of observations.
An issue is to how to choose the right k (the number of clusters). In one word, we would try to find the spot where adding more clusters no longder provides a significant decrease in SST(known as elbow approach).
There are some further considerations about k-means. To start off, it is sensitive to outliers. That is why we take the median of a set of numbers ranther than the mean. Also, we should acknowledge that it requires the data to be numerical.In the end, we need to keep in mind, there is no obvious method of assessing the solution we get. We cannot use cross-validation since there is no such thing as class. One popular approach invovles examining the stability of a clustering solution.
One example can be shown by following 2-dimensional data set.Details
f1 = data['V1'].values
f2 = data['V2'].values
X = np.array((list(zip(f1,f2))))
plt.scatter(f1,f2,c="pink",s=8)
centroids = {}
for i in range(k):
    centroids[i] = X[i]

#we use error to stop the loop
#error = dist(C,C_old,None)
#find the distance and assign the point
classes = {}
for i in range(k):
    classes[i] = []
for features in X:
    distances = [np.linalg.norm(features - centroids[c]) for c in centroids]
    classification = np.argmin(distances)
    print(classfication)
    classes[classification].append(features)
previous = dict(centroids)
#average the cluster to re-calculate the centroids
for classfication in classes:
      centroids[classfication]=np.average(classes[classfication],axis=0)
isOptimal = True
for centroid in centroids:
    ori_centroid = previous[centroid]
    curr = centroids[centroid]
    if np.sum((curr - original_centroid)/original_centroid * 100.0) > self.tolerance:
        isOptimal = False
if isOptimal:
		break